dB SPL is a measure of sound pressure levels in air. It’s measured in dB and is a standardized way of comparing the sound pressure levels of different sound events. It’s widely used in the field of audiology, which deals with human hearing, and also in audio recording and listening applications. It can be translated to other scales—dBA and dB HL—that are used to adjust dB SPL measures to account for the way that humans perceive sound at different frequencies.
In this article we’ll look at:
What is dB SPL used for?
dB SPL is a measure of sound pressure levels in air. It’s measured in decibels (dB) relative to a pressure of 20 micro pascals.
dB SPL is widely used for calibrating signals in hearing test equipment.
It’s also used in a range of audio-acoustic applications, such as for measuring microphone sensitivities.
Microphone sensitivities
A microphone’s sensitivity is typically estimated using a 1 kHz sine wave at 94 dB SPL (equivalent to 1 pascal of air pressure). The microphone’s sensitivity is measured as its response to the 94 dB SPL signal.
A common specification used in microphones and other audio-acoustic equipment is the max SPL.
A microphone’s max SPL refers to the maximum amount of sound pressure that the microphone can handle (measured in dB SPL) before producing audible levels of distortion.
Condenser mics, for instance, typically have lower max SPLs than dynamic mics. This is because condenser mics contain active electronics and are more sensitive than dynamic mics.
Most modern condenser mics, however, can withstand a fairly large SPL before distorting. But cheaper, or older, condenser mics may not.
The max SPL, therefore, is an important metric to be aware of in microphone recording applications.
Common sound events measured in dB SPL
More generally, dB SPL provides a standardized way of measuring sound pressure levels in a range of situations.
The following table lists sound pressure levels—measured in dB SPL—for several common sound events in order of increasing loudness:
| Sound Event | Typical Sound Pressure Level (dB SPL) |
|---|---|
| Hearing threshold | 0 |
| Leaves fluttering | 20 |
| Whisper in an ear | 30 |
| Normal speech conversation | 60 |
| Passing cars (close by) | 60 -100 |
| Airplane taking off (close by) | 120 |
| Human pain threshold | 120 – 140 |
How is dB SPL calculated?
dB SPL is calculated in a similar manner to dB, although it uses a 20 micro pascal reference level. It’s calculated as follows:
dB SPL = 20log10(P1/P0)
Where, P1 is the sound pressure level (in pascals) that you’re measuring, and P0 is the reference sound pressure level of 20 micro pascals (i.e., 0.00002 pascals).
Converting between pascals (Pa) and dB SPL
Using the formula for dB SPL, it’s easy to convert between the sound pressure of an event—measured in pascals (Pa)—and its dB SPL. The table below shows this for a range of common sound events:
| Sound Event | Sound Pressure (Pa) | Sound Pressure Level (dB SPL) |
|---|---|---|
| 30 meters from a military aircraft at take-off | 200 | 140 [=20log10(200/.00002)] |
| Pneumatic chipping and riveting (operator’s position) | 63 | 130 |
| Boiler shop (maximum levels) | 20 | 120 |
| Automatic punch press (operator’s position) | 6.3 | 110 |
| Automatic lathe shop | 2 | 100 |
| Construction site—pneumatic drilling | 0.63 | 90 |
| Kerbside of busy street | 0.2 | 80 |
| Loud radio (in average domestic room) | 0.063 | 70 |
| Restaurant | 0.02 | 60 |
| Conversational speech at 1 meter | 0.0063 | 50 |
| Whispered conversation at 2 meters | 0.002 | 40 |
| Background noise in TV and recording studios | 0.0002 | 20 |
| Normal hearing threshold | 0.00002 | 0 |
(source: Fans and Ventilation, 2005, Table 14.2)
You may notice that a value of 0 dB SPL corresponds to the threshold of human hearing—this is the faintest sound pressure level at which it’s possible (for a human) to start hearing a sound.
You may also notice that the sound pressure levels increase exponentially for different events—drilling at a construction site generates 10x the sound pressure level of a (loud) radio, which, in turn, generates 10x the sound pressure level of a normal conversation.
This exponential nature in which sound pressure levels increase is why they are measured using a logarithmic scale—i.e., dB SPL—as shown by the formula.
dB SPL vs dBA
So far, we’ve been talking about the sound pressure levels that various sound events generate. But we haven’t considered the frequencies of the sound events.
Sound travels in waves, and those waves have frequencies. Most sounds that we encounter are actually made up of many frequencies.
When we hear a sound, we’re usually hearing a range of frequencies at the same time.
As it happens, our ears don’t hear all frequencies equally—they hear different frequencies at different levels of loudness.
Human hearing is a complex process. It starts with collecting sound waves by our outer ears (carried by the movement of air particles), then amplifying them in our middle ears, and finally transforming them into electrical signals in our inner ears.
After that, how we actually perceive sound depends on how our brains interpret the signals that are sent from our inner ears.
The whole process of hearing, and the various parts of our ears that sound waves need to pass through, means that the energies of different frequencies get attenuated (reduced) to different extents.
As a result, humans have different levels of sensitivity to different frequencies of sound—dBA is a weighted scale that accounts for this by making adjustments for the way that human hearing varies by frequency.
The table below illustrates how dBA works.
For the sound pressure levels shown, measured in dB SPL, an adjustment is applied at each frequency—known as the A-weighting scale—to arrive at a corresponding dBA value for each frequency.
| Sound Frequency (Hz) | Sound Pressure Level (dB SPL) | A-weighting (dB) | A-weighted Sound Pressure Level (dBA) |
|---|---|---|---|
| 62.5 | 54 | -26 | 28 |
| 125 | 60 | -16 | 44 |
| 250 | 64 | -9 | 55 |
| 500 | 53 | -4 | 49 |
| 1,000 | 48 | 0 | 48 |
| 2,000 | 43 | +1 | 44 |
| 4,000 | 39 | +1 | 40 |
| 8,000 | 32 | -1 | 31 |
As shown in the table above, the A-weighting that’s used to calculate dBA reduces the sound pressure levels at low frequencies (below 1,000 Hz) and high frequencies (above 8,000 Hz). This is because human ears are less sensitive to very low and very high frequencies.
While dBA is often used to account for human perceptions of loudness, when used in audio applications it can underestimate the impact of noise at low and high frequencies—this can lead to a misunderstanding of the true levels of noise in some situations.
dB SPL in audiology
Since dB SPL measures sound pressure levels in air, which is fundamental to the way in which sound travels for human hearing, it’s an important consideration in the field of audiology.
Audiology is practiced by audiologists and deals with the study of human hearing (and balance) disorders.
dB HL
As we’ve seen, humans perceive hearing differently at different frequencies, and this is what the dBA scale adjusts for.
But while dBA applies an adjustment to any set of sound pressure levels at different frequencies, audiologists are often interested in knowing how a person’s hearing compares with “normal” hearing levels at each frequency.
To provide a ready reference of normal hearing levels at each frequency, the dB HL (Hearing Level) scale was developed.
dB HL is a reference scale that’s based on measurements of groups of people (test groups) to determine what the average—or normal—hearing levels are at various frequencies.
Different countries have different db HL scales that record normal hearing levels for people in each country.
dB SPL vs dB HL
In the US, a commonly used dB HL scale is based on the American National Standard Specification for Audiometers (ANSI S3.6-1996).
The table below shows the conversion between dB SPL and dB HL based on ANSI S3.6-1996:
| Sound Frequency (Hz) | Sound Pressure Level (dB SPL) | Hearing Level (dB HL) Reference |
|---|---|---|
| 125 | 45 | 0 |
| 250 | 27 | 0 |
| 500 | 13.5 | 0 |
| 750 | 9 | 0 |
| 1,000 | 7.5 | 0 |
| 1,500 | 7.5 | 0 |
| 2,000 | 9 | 0 |
| 3,000 | 11.5 | 0 |
| 4,000 | 12 | 0 |
| 6,000 | 16 | 0 |
| 8,000 | 15.5 | 0 |
A value of 0 dB HL refers to a normal hearing level at each frequency in the table above. This is taken as a point of reference at each frequency.
When an audiologist measures a person’s hearing across a range of frequencies, they produce an audiogram that will record the person’s hearing levels relative to the 0 dB HL scale.
Below is an example of an audiogram for a person in a healthy hearing range—their dB HL measurements across all frequencies are in a typical range above and below zero dB HL.
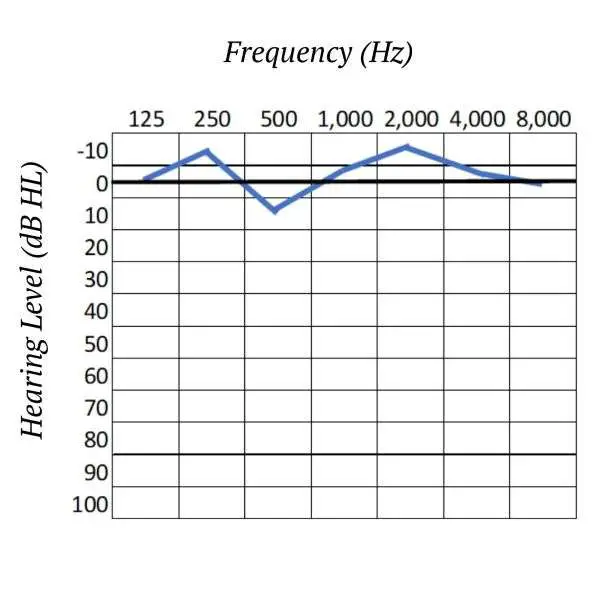
In the above audiogram, if a person has a worse than normal level of hearing at the 500 Hz frequency, for instance, then they may record a level larger than 13.5 dB SPL (say, 22.0 dB SPL), i.e., the faintest sound that they can hear at this frequency needs to be louder than normal.
This will translate to a positive number for their dB HL measure in the audiogram at this frequency (+8.5 dB HL, in this example).
Similarly, if a person has a better than normal level of hearing at the 2,000 Hz frequency, for instance, then they may record a level smaller than 9.0 dB SPL (say, 1.5 dB SPL), i.e., the faintest sound that they can hear at this frequency is softer than normal.
This will translate to a negative number for their dB HL measure in the audiogram at this frequency (-7.5 dB HL, in this example).
Conclusion
dB SPL is a measure of sound pressure levels in air. It’s measured in dB and uses a reference level of 20 micro pascals of sound pressure.
dB SPL is used widely in audiology and other audio-acoustic applications, such as for measuring microphone sensitivities.
dB SPL is often converted using dB weighting scales—dBA and dB HL—as these provide adjustments to account for the way in which humans perceive sound differently at different frequencies.
Audiologists create audiograms of a person’s hearing using the dB HL scale. Based on this, they can determine if a person’s hearing levels are better or worse than normal at each frequency.